Job Search Tracking Dashboard.
Job Tracking Dashboard
View the Dashboard
You can view the interactive dashboard here: Job Search Tracking Dashboard
Overview
The purpose of this project is to track my job applications through a dashboard, allowing me to better understand how my job search is progressing. This dashboard helps monitor key data such as:
- Number of applications submitted
- Current status of applications
- Companies applied to
My goal was to dive into the data to evaluate the responses I've been receiving and identify areas for improvement.
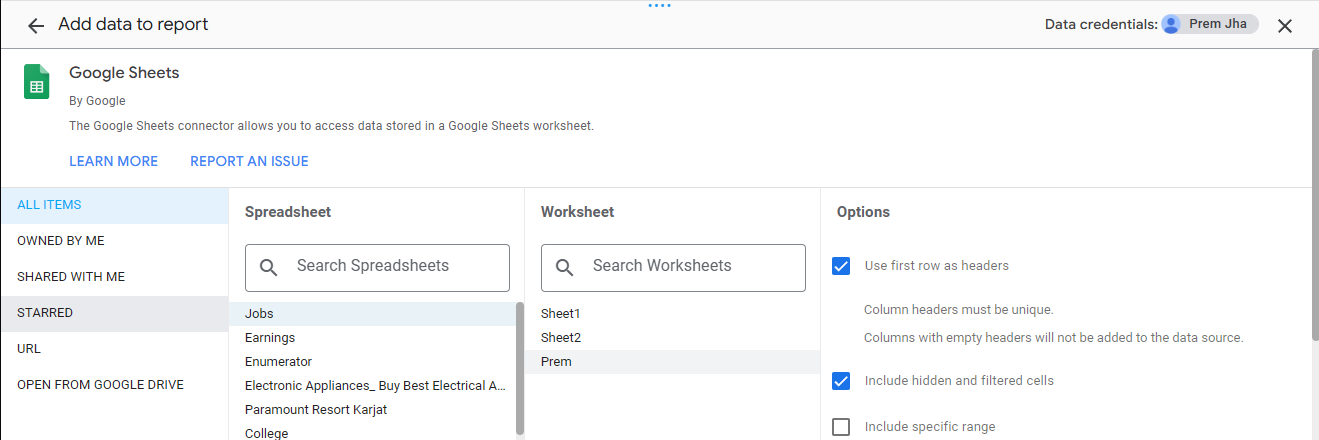
I used Google Looker Studio with its built-in connector for Google Sheets. Since all data was manually tracked in Google Sheets, minimal cleaning was required.
Data and Dashboard Setup
Data
I’ve been tracking:
- Company applied to
- Date of application
- Position applied for
- Application status
- Comments
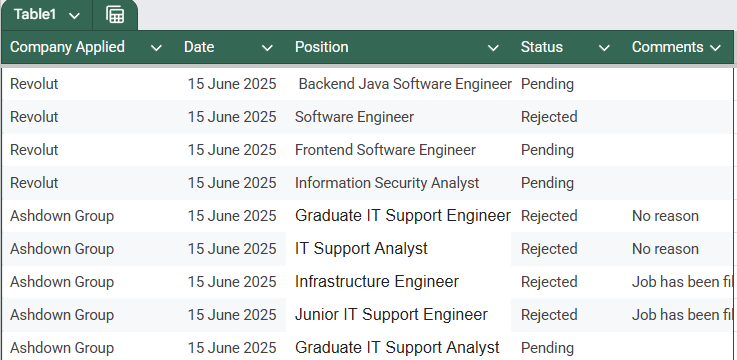
🔢 Currently tracking 40 rows of data, automatically connected to the dashboard — no ongoing maintenance required.
Dashboard Connection
To connect Google Sheets to Looker Studio:
- Use the Google Sheets connector
- Authorize Looker Studio access
- Select the spreadsheet and worksheet
- Keep default settings
Once connected, the data was ready for analysis.
Dashboard Analysis
1. Overview Metrics Snapshot
Key metrics display the job application journey:
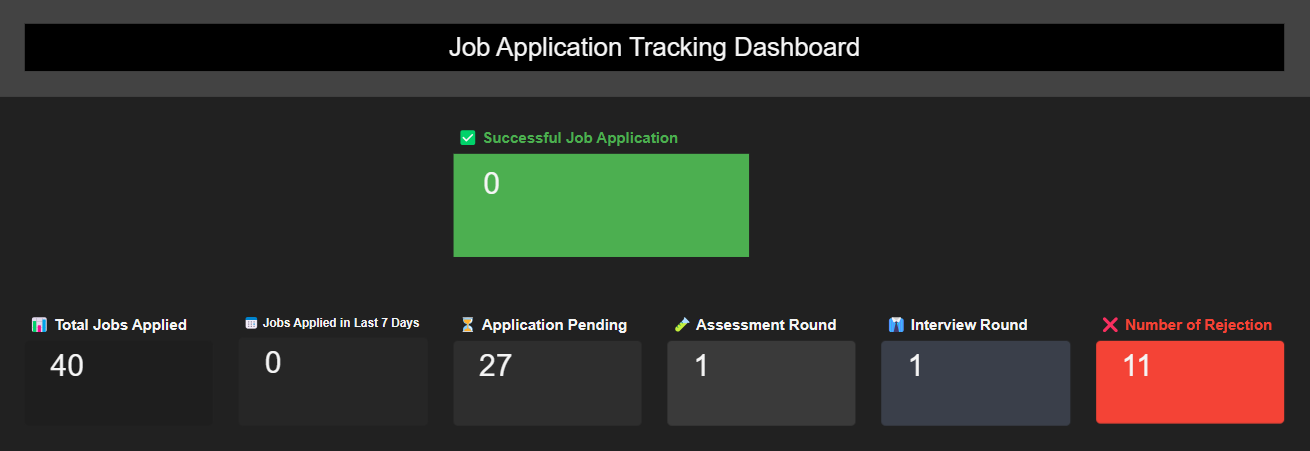
- Total Applications: 40
- Successful Applications: 0
- Applications in Last 7 Days: 0
- Applications Pending: 27
- Assessment Rounds: 1
- Interview Rounds: 1
- Rejections: 11 (~28%)
2. Application Status Breakdown
A pie chart shows:
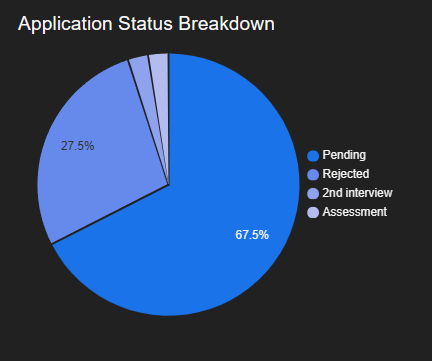
- Pending: 67.5%
- Rejected: 27.5%
- Assessment/Interview: ~5%
Insight: Most applications are still in limbo. Follow-up and analyze response times.
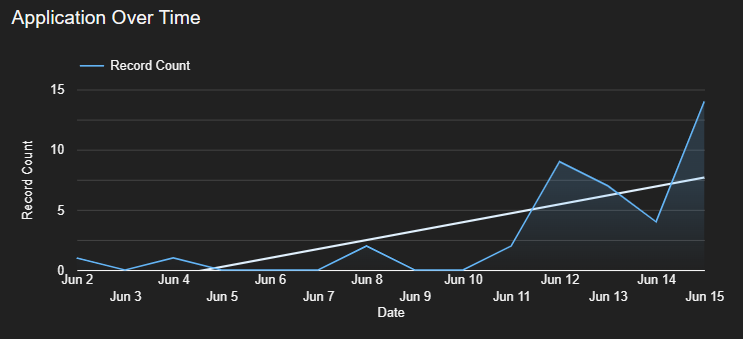
3. Application Activity Over Time
The timeline shows:
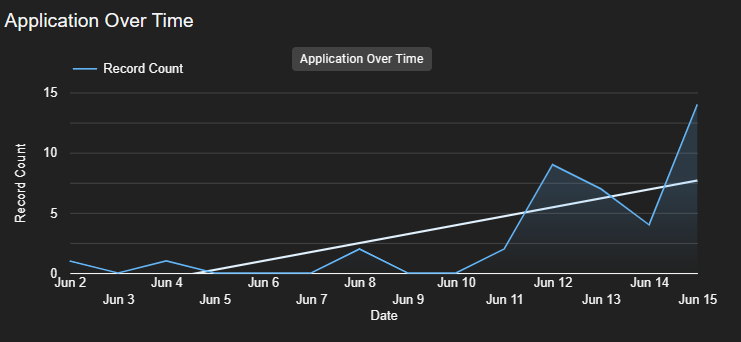
- Peak activity: June 5–15
- No new applications in the past 7 days
Insight: Consider re-engaging with job portals and recruiters.
4. Applications by Company
- Ashdown Group: 10
- Revolut: 7
- Others (Illumina, Tesco, bet365): 1–2 each
Insight: Broaden exposure by diversifying industries and company sizes.
5. Role Distribution Across Companies
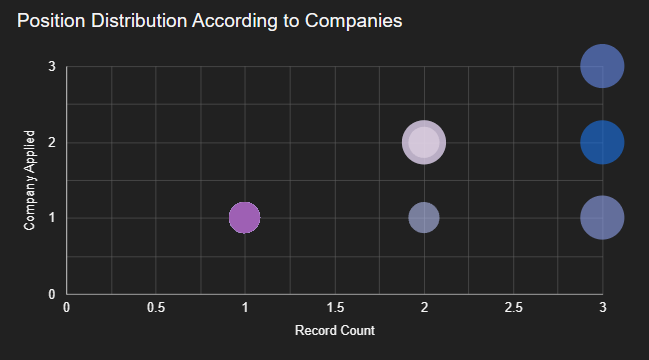
Ashdown Group shows multiple roles; other companies show more targeted roles.
Insight: Expand role types or revisit skill-related job titles to increase opportunities.
Future Updates
Planned enhancements:
- Automate data collection from email/job boards
- Improve word cloud clarity and relevance
- Add metrics like:
- Application-to-interview ratio
- Time-series graph for response tracking
Summary
This dashboard provides a clear overview of my job search progress, highlighting key metrics such as total applications, status breakdown, and company/role distribution. The analysis reveals that most applications are still pending, with a significant portion concentrated in a few companies and roles. Insights suggest the need to diversify applications, follow up on pending responses, and expand the range of roles targeted. Planned updates aim to automate data collection and enhance the dashboard's analytical capabilities for more effective job search tracking.